This chart shows why everyone on Wall Street is so worried about the yield curve
Wall Street’s top rated economist Ed Hyman just called the yield-curve inversion “the number one” market risk, and this chart shows why.
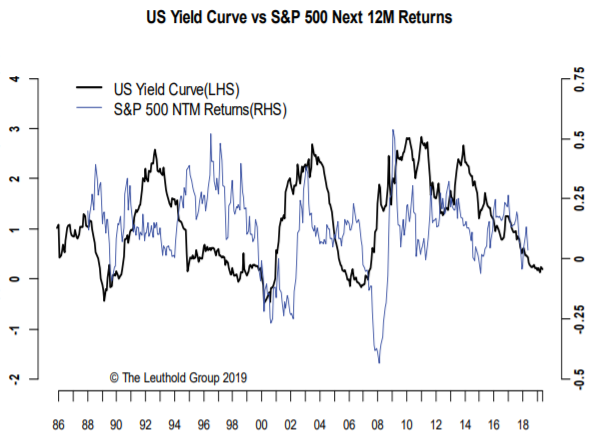
Going back to 1986, when the yield curve turned flatter drastically and eventually inverted, the S&P 500 tends to go into a downward spiral within the next 12 months, according to The Leuthold Group.
Take 2004 when the yield spread started falling from its highs. The flattening didn’t get the market’s attention until about 2006 when the curve inverted, and the recession hit exactly a year later.
There’s “a positive relationship between the yield curve and the S&P 500’s next 12-month returns,” said Chun Wang, Leuthold’s senior analyst and portfolio manager, in a note. “Recession or not, a flatter curve generally bodes ill for future stock market performance. The current trend in the yield curve is likely to cap the upside for stocks in the next 12 months.”
Keep in mind that Wang tested the spread between the 10-year and 2-year Treasury yields, not the 3-month and 10-year yield curve that’s currently inverted. Yield-curve inversion has been a reliable recession signal closely watched by experts and the Federal Reserve.
.1560527243900.jpeg)